Report - Utility Bill Savings Section
Report - Utility Bill Savings Section
The Utility Bill Savings Section shows detailed monthly information about the energy and demand usage, costs, and savings for the modeled scenario.
The detailed results for any graph or table can be seen by right clicking on them and choosing Show Table.
Saving Summary Subsection
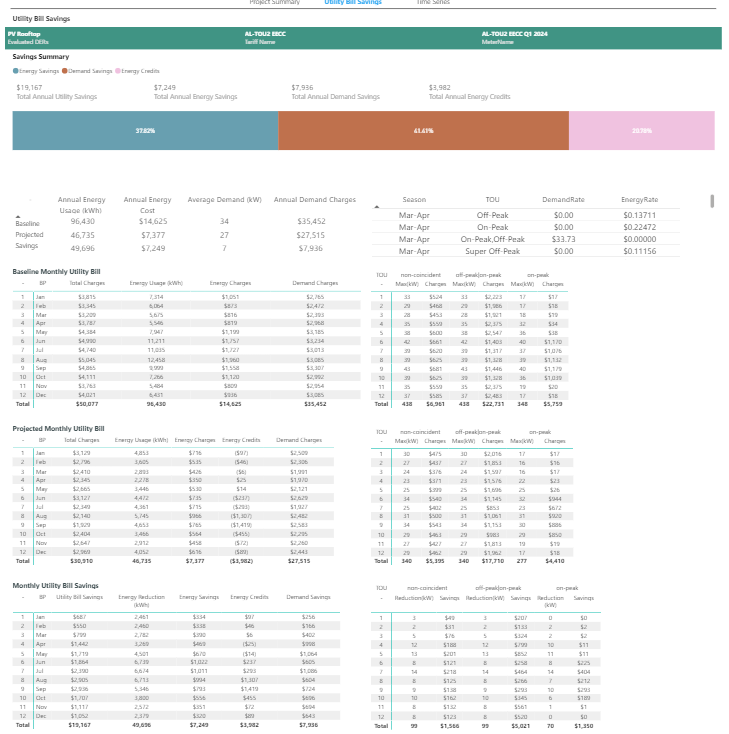
Savings Summary - Shows the total annual utility savings with a breakdown by energy savings, demand savings and energy credits, if applicable.
Baseline Monthly Utility Bill - Shows a breakdown by calendar month of the utility bill before the introduction of the evaluated DERs. These charges are divided into total charges, energy usage (kWh), energy charges, service charges, and demand charges for the billing period. Total monthly demand charges are detailed in the right-hand TOU table.
Projected Utility Bill - Shows a breakdown by calendar month of the utility bill with the selected DERs. These charges are divided into total charges, energy usage (kWh), energy charges, service charges, and demand charges for the billing period. Total monthly demand charges are detailed in the right-hand TOU table.
Monthly Utility Bill Savings - Shows a breakdown by calendar month of the utility bill savings. These savings are divided into total savings, energy reductions, energy savings, applied energy credits and demand savings for the billing period. Total monthly demand savings are detailed in the right-hand TOU table.
Energy Savings Analysis Subsection
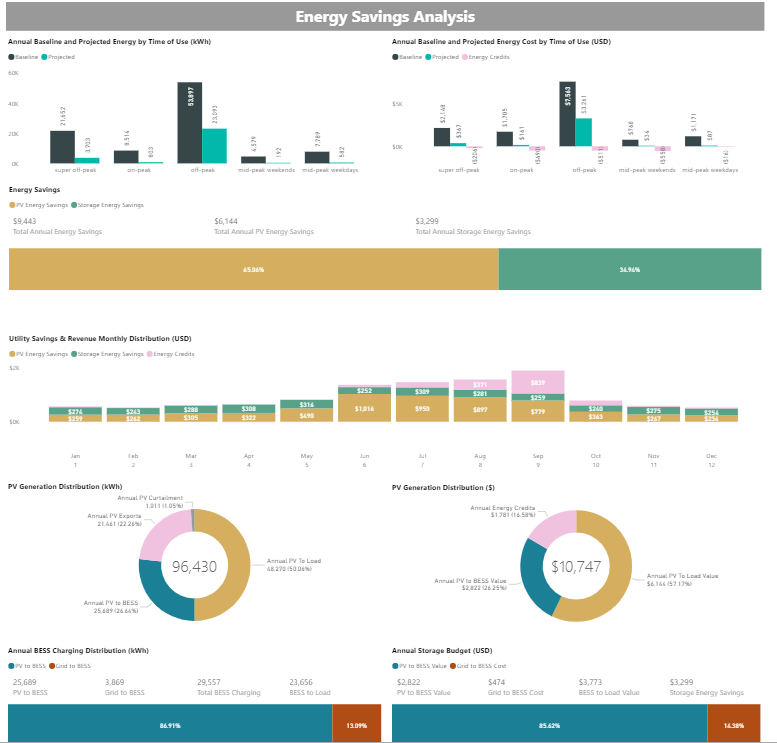
Baseline and Projected Energy by Time of Use (kWh)– This chart provides information on the total energy consumed (kWh) during the different time of use periods, categorized by baseline vs. projected.
In this example:
- Off-Peak- The time of the day when the demand is generally lower than peak.
- On-Peak- The time of the day when the demand is generally the highest. The time is often between 4:00 PM and 9:00 PM. Also, the highest cost energy and, likely, the highest demand charges.
- Super Off-Peak - The time of the day when demand is generally lowest, most often overnight during weekdays. Also, the lowest cost energy and, likely, no demand charges.
- Mid-Peak - This tariff has a time of day that replaces the peak in the winter and on summer weekends.
Baseline and Projected Energy Costs by Time of Use – This chart provides information on the total energy costs during the different time of use periods, categorized by baseline, projected, and energy credits.
In this example:
- Total Coincident: On-Peak in Summer and Mid-Peak Weekdays in Winter
- Total Non-Coincident: Off-Peak | On-Peak | Super Off-Peak
Utility Savings & Revenue Monthly Distribution - This chart shows the monthly distribution of PV energy savings, storage energy savings and energy credits in dollars.
PV Generation Distribution- These charts provide an annual summary on energy generation detailed in annual PV Exports, Annual PV to Load, Annual PV to Bess and annual PV curtailments in kWh and in dollars.
Annual BESS Charging Distribution- If battery storage is included in the scenario, this graph will show the annual charging distribution from PV or Grid.
Annual Storage Budget - If battery storage is included in the scenario, this graph will show the annual costs/value to charge. Storage Savings = BESS to Load Value - Grid to BESS Cost.
Demand Response Programs Revenue/Savings Subsection
Though this section is always shown, it only applies (and will be populated) if one of the selected modeled tariffs represents a demand response program. Currently mVSO supports California's critical-peak-program tariffs.
A full explanation of the methodology used for calculation of demand response programs can be found here.
Note: Modeling the CPP program in California can take an hour or more to solve.
Related Articles
Savings Calculations
Savings Calculations On the Scenario Report's Utility Bill Savings section, we occasionally field questions about how we calculate savings totals. This article details about each calculation and explains how some rate structures impact the results. ...Report Section - Overview
Report Section Overview The optimization results report is an interactive set of visualizations detailing multiple aspects of the scenario's financial and operational results. The report comprises three sections, each with a different focus: Project ...Report - Summary Section
Report - Summary Section This page provides top-level financial and equipment information for the modeled scenario. The summary includes cost and savings breakdowns, project location or uploaded site plan, total system power and storage capacity (if ...Solar Retrofit Modeling
Solar Retrofit Modeling Starting in March 2025, Keystone Designer supports modeling solar retrofits. A solar retrofit is a scenario where there is an existing solar array, and project stakeholders want to explore adding additional solar and/or an ...Viewing and Sharing Results
Viewing and Sharing Results The results of your optimization scenario can be accessed in two ways. 1. The email notification sent when the scenario run is complete contains a link to the results report. 2. On the project page within the Keystone ...